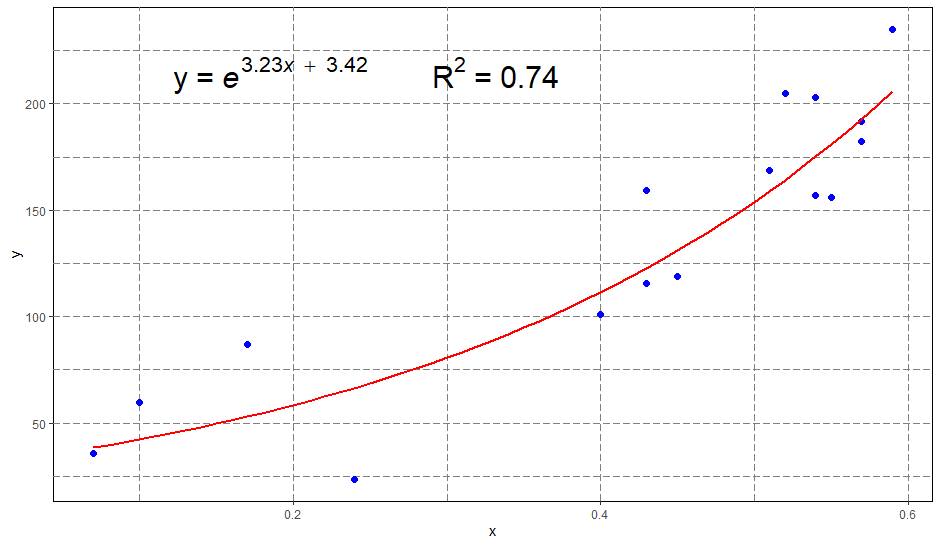
Как добавить уравнение экспоненциальной регрессии и R2 на график ggplot?
library(ggplot2)
x <- c(0.54, 0.59, 0.57, 0.54 ,0.10, 0.07, 0.17, 0.24,
0.51, 0.57, 0.55, 0.52, 0.40, 0.43, 0.45, 0.43)
y <- c(156.9, 234.8, 191.9, 203.2, 59.8, 36.0, 87.2, 23.8, 168.7,
182.3, 155.8, 205.1, 101.2, 115.5, 118.8, 159.1)
df <- data.frame(x, y)
# Package 'expectreg' reference manual
exp.mod <- lm(log(y) ~ x, df)
new_x <- seq(min(x), max(x), 0.01)
prediction <- exp(predict(exp.mod, newdata = list(x = new_x)))
exp_line <- data.frame(x = new_x, y = prediction)
eq <- paste0('paste(y, " = ", italic(e^{', round(exp.mod$coefficients[2], 2),
"*x ~~+~~ ", round(exp.mod$coefficients[1], 2),
'}), ~~~~~~~~R^2~ "="~', round(summary(exp.mod)$r.squared, 2), ")")
my_plot <- ggplot(data = df, mapping = aes(x, y)) +
geom_point(shape = 16,size = 2,colour = 'blue') +
geom_line(data = exp_line,colour = 'red',linewidth = 1) +
geom_text(aes(x = min(x) + 0.1 * diff(range(x)),
y = min(y) + 0.9 * diff(range(y)), label = eq,),
parse = TRUE, size = 8, check_overlap = TRUE, hjust = 0)+
theme(
panel.background = element_rect(fill = "white",
color = "black",
size = 0.5, linetype = "solid"),
panel.grid.major = element_line(size = 0.5, linetype = 'longdash', color = "grey50"),
panel.grid.minor = element_line(size = 0.25, linetype = 'longdash', color = "grey50")
)
my_plot